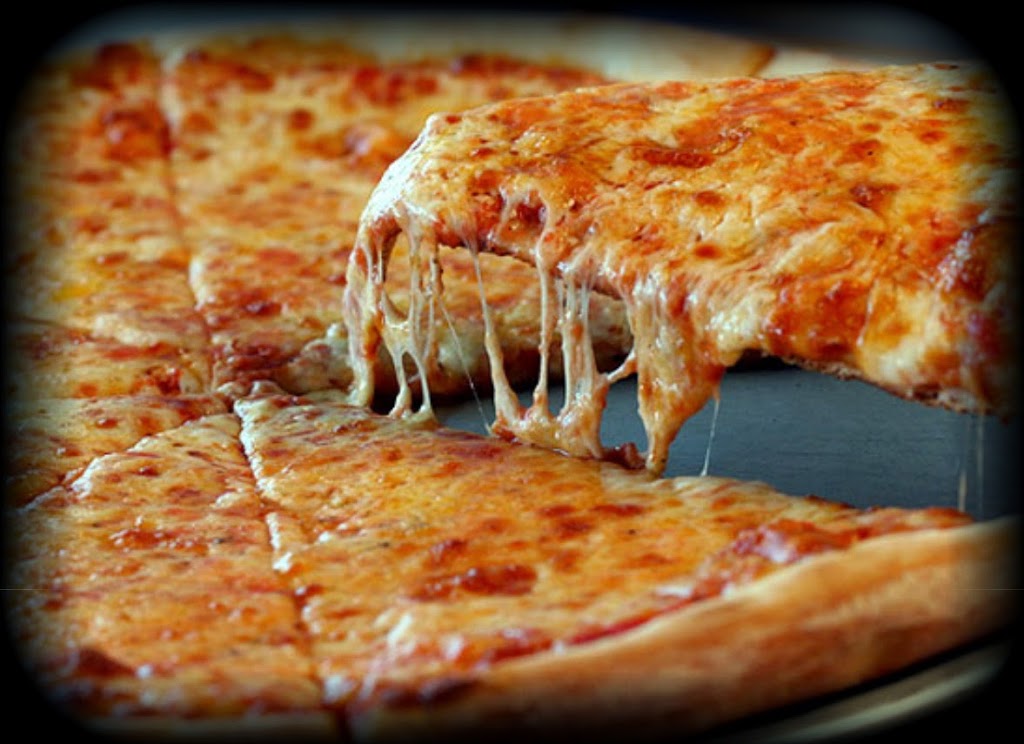
Who are the real pizza experts out there? Sure, Pat Doyle of Domino’s, and Papa John’s John Schnatter spring to mind. But the biggest expert turns out to be a guy named Tom Vilsack. Not a name familiar to you? Haven’t ordered a pie from him recently? Well, not surprising, because he’s the U.S. Secretary of Agriculture.
Why is he an expert? Well, he leads more than 100,000 USDA employees responsible for a menu of things, not the least of which are food safety and ending hunger. With all they have on their plates, you can imagine they put in some pretty late nights down at the USDA building in Washington, DC, and on more than one occasion probably ordered in for dinner. And probably pretty regularly from one or another of the 43 pizza places Yelp identifies within delivery range of their offices. With all that pizza access, you’d expect they’d develop an expertise about pizza, and they have apparently, because they’ve just issued a new USDA report all about it.
Pizza: oven-baked flat dough, tomato sauce, cheese, and sometimes toppings, so why all the bother? Why a report? Well, it turns out the U.S. accounts for one-third of the annual global pizza market, and our piece of that pie is $37 billion. So a lot of dough, and undoubtedly worth a report. And, for your interest and convenience, we’ve extracted some insights from that report about this quite substantial and lucrative category:
- In just under 2 decades, per capita pizza consumption of pizza has gone up 41%.
- On any given day 13% of Americans eat pizza, an individual average consumption of 744 calories.
- Four percent (4%) of that pizza is eaten for breakfast, 54% for snacks and lunches, leaving the remaining 42% of the pie for dinner.
- Top-5 toppings: Pepperoni, mushrooms, onions, sausage, and bacon.
- About 40% of pizza orders are for “a regular pie,” meaning just plain cheese. “Extra cheese” is considered a topping and was #6 on the toppings list, just ahead of black olives.
- Pizza consumers get between 25% and 33% of their daily energy from pizza.
- From a nutritional perspective a daily serving of pizza accounts for 50% of consumers’ lycopene, 39% of saturated fat, 37% of calcium, and 35% of protein.
- That’s the word from the experts. What about the loyalists?
Given that $37 billion identified by the Department of Agriculture, you’d figure all the national pizza brands are looking for some of that dough for themselves. Sure, you can earn some with ads and promotions and breadsticks, but if you want to guarantee the largest slice of the category pie, you need to engage customers and create loyalty. Customers, as it turns out, are the “loyalists.”
Loyalty, whether to pizza, smartphones, or credit cards is a leading-indicator of positive consumer behavior, which correlates very highly with sales and brand profitability, so it’s a critical metric for any brand to measure. And not to put a damper on our pizza party, but it turns out that most brands don’t do it all that well.
To really do it well you have to be able to accurately measure how well your brand measures up to the expectations consumers hold for their Ideal. In this case, their Ideal Pizza. Consumer expectations are generally high, and are getting higher every year, and it’s only the consumers who know what they really want – even if they can’t always articulate it, But there are ways to figure out what they really think, which, we guess, also makes them “experts” as well. OK, not so much in terms of the business end of pizza, but certainly in terms of what they expect when they make the decision to buy one.
More emotionally-driven categories have higher expectations that grow faster, and according to the USDA report, consumers are passionate about pizza. Pizza expectations are up nearly 25% while the national brands have (on average) only been able to meet this expectation growth by 7%, albeit some better than others.
To be able to deep-dish with you about how well the national brands are meeting those expectations and, thus, which should currently have the most loyal customers (and higher profits), we sliced into another report about pizza: the Brand Keys 2014 Customer Loyalty Engagement Index (CLEI) and identified the following pizza brand rankings. Percentages indicate how well the brand is meeting expectations of the brands’ own customers, as compared to their Ideal, calculated to be 100%:
- Domino’s (90%)
- Papa John’s (87%)
- Pizza Hut (83%)
- Little Caesars (81%)
- Papa Murphy’s (80%)
- Sbarro (75%)
- Chuck E. Cheese (70%)
So – according to the expert-loyalist consumers – there’s room for improvement everywhere. In fact, sticking with our theme, you could say that there’s ‘mushroom’ for a smart pizza brand to rise to the occasion and deliver a product much closer to, what consumers really want. But, as we said, it’s always helpful if you know precisely where you stand, because the bottom line – in any category – is brands that deliver real emotional engagement to the consumer, also deliver to the bottom line of the corporation.
Domino’s, #1 according to the CLEI report, announced last week that their fiscal first-quarter net income rose 18%, beating analysts’ expectations earning $40.5 million, with same-store sales up nearly 5%.
Which from an engagement, loyalty and financial perspective isn’t too cheesy at all.
Connect with Robert on LinkedIn.
Find out more about what makes customer loyalty happen and how Brand Keys metrics is able to predict future consumer behavior: brandkeys.com. Visit our YouTube channel to learn more about Brand Keys methodology, applications and case studies.
Share this:

